
Tuesday, December 31, 2013
Saturday, November 30, 2013
Monthly Volume Profile Analysis: November
Nifty Spot Volume Profile:
The index started the month with the highs for the year at 6342.95 on Mahurat trading day on 3rd November but saw the euphoria of an all time high ending with profit booking setting in for the next few days to make a low of 5972.45. The index though covered much of its loss and ended the month on a bullish note at 6176.10, still a loss of around 2.0% for the month.The range was 370.50, much lower compared to the last few month and the ATR(12) moved down to 460.60 points.

The Monthly Spot Profile Values are: VAH-6169, POC-6071, VAL-5972 and Monthly VWAP at 6129
Nifty as per profile has closed above all values and looks good for more, and only a close below VWAP at 6129 can see change of trend to Bearish. Staying above MVAH, a move towards all time high is possible. Till VWAP is not breached on closing basis, participants can buy with small Stop Loss for higher levels, else can sell for MPOC and MVAL.
Crucial Level for the Month is stationed at 6129 and 6071
BankNifty Spot Volume Profile:
Bank Nifty had negative month with the index losing around 2.8%, though it made a high of 11736.20 but closed at 11153.95. The intermediate low was at 10412.00.The ATR(12) for the month came down at 1442.22, with the range being only 1324.20 points and volatility also lower than the previous few months.

The Monthly Spot Profile Values are: VAH-11162, POC-10852, VAL-10541 and Monthly VWAP at 11016.
BankNifty as per profile has closed just a few points below VAH, which points to a range bound month, but a close above VAH for a few days can bring in higher levels at 11420 and 11740 but staying below can see lower levels at VWAP and POC. A close below POC will be sure sign of huge weakness.
Sunday, November 3, 2013
Nifty & BankNifty Monthly Volume Profile Analysis - October
Nifty Spot Volume Profile Analysis :
A terrific month for the Bulls, which started from the lows on the first day at 5700.95 and closed at the high on the last day at 6299.15, a super gain of 600 points and in effect had an all time highest monthly close. Nifty is just a few points away from all time high of 6357.10 and based on the momentum it may be scaled in the first week of November.
This range for the month was 608.10, much lower than that of previous month and the ATR(12) was was 468.80 points. The big range days of September reduced drastically and we had a few 100 points days.

The Monthly Spot Profile Values are: VAH-6246, POC-6103, VAL-5960 and Monthly VWAP at 6084
Nifty as per profile has closed above all values and looks extremely strong, and only a close below VAH can see corrective towards POC at 6103 and VWAP at 6084. Till VWAP is not breached on closing basis for at least 2 days, it’s a BUY ON DIPS.
Crucial Level for the Month is stationed at 6246 and 6084
BankNifty Spot Volume Profile Analysis:
Bank Nifty had a great month with the index adding 1855.40 points or approx 19.30%, the highest monthly gain in the last 3 years. The index closed just below the 61.8% level of the fall from 13414 to 8367, stationed at 11486..
The ATR(12) for the month was at 1453.14, upstaging the one of last month, with many 400 points day with the highest range of 599.20 on 29th October.

The Monthly Spot Profile Values are: VAH-11465, POC-10866, VAL-10267 and Monthly VWAP at 10616.
BankNifty as per profile has closed above all values areas and looks bullish. Immediate resistance is the Virgin POC at 11832. Weakness will creep in below 11465 with change of trend below 10866 or below the Monthly VWAP of 10616.
Wednesday, October 30, 2013
Opening Bell for 30th-Oct-2013
Good Morning !! NIFTY may open positive to gap-up. Above 6252 NIFTY may target 6299/6320/6345..we should remain cautious at higher levels. Aggressive traders may short NIFTY at higher levels around 6299-6320.
Wish you profitable day.
Wish you profitable day.
Tuesday, October 29, 2013
Opening Bell for 29-OCT-13
Good Morning !! NIFTY may open flat to positive. Trading above 6130-6150 may bring some relief to the bulls but as of now "sell the high" should be strategy for trading NIFTY. Today, we may see some downmove after consolidation. Trading below 6090, NIFTY may target 6060/6010/5980.
Wish you profitable day.
Wish you profitable day.
Friday, October 25, 2013
Weekly analysis of NIFTY - 25th Oct. 2013
This week we saw narrow range of 136 points in NIFTY but within this narrow range we saw some interesting observations as follows:-

1. NIFTY made new yearly high at 6252.
2. Negative divergence in weekly chart.
3. Larger volume compared to average volume of previous 8 weeks.
4. Bearish harami candle stick pattern.
4. Overbought stochastc and CCI.
Some important observation that we have found in daily chart :-

1. NIFTY closed in -ve for four consecutive days.
2. Selling cross in MACD
3. Overbought CCI and RSI.
From weekly and daily chart, we can conclude that NIFTY is heading for lower levels.
 But presence of bullish Gartley Pattern ensures some upmove towards 6200 which can be good selling opportunity.

1. NIFTY made new yearly high at 6252.
2. Negative divergence in weekly chart.
3. Larger volume compared to average volume of previous 8 weeks.
4. Bearish harami candle stick pattern.
4. Overbought stochastc and CCI.
Some important observation that we have found in daily chart :-

1. NIFTY closed in -ve for four consecutive days.
2. Selling cross in MACD
3. Overbought CCI and RSI.
From weekly and daily chart, we can conclude that NIFTY is heading for lower levels.

Thursday, October 24, 2013
Opening Bell : 24/10/2013
Good Morning !! NIFTY may open flat to positive. Trading above 6198, NIFTY may target 6230/6280/6315...whereas trading below 6160, NIFTY may target 6120/6080/6030. After some consolidation we may see either side breakout in NIFTY.
Wish you profitable day.
Wish you profitable day.
Monday, September 30, 2013
Nifty & BankNifty Monthly Volume Profile Analysis - September
Nifty Spot Volume Profile:
A month where the Bulls ruled for most of the days but saw huge unwinding due to increase in Repo rate by 0.25% by RBI Governor Raghuram Rajan and end of the Bull run. The index saw an increase of around 823 points within the first 3 weeks to the highs of the month at 6142.50 but the unwinding during the last few days saw the month end at 5735.30, still a gain of 263.50 points of around 4.8%.
This is was the highest range month of the year and the ATR(12) increased to 456.13. The index saw many big range days with highest one day gain of more than 216 points in years.

The Monthly Spot Profile Values are: VAH-6130, POC-5876, VAL-5622 and Monthly VWAP at 5797
Nifty as per profile has closed just below VWAP, and staying below the same can see VAL at 5622, and below 5622 close, previous months values can come into play. Bulls can breathe easy only on a close above POC at 5876, till then it’s a SELL ON RISE.
Crucial Level for the Month is stationed at 5797 and 5876
BankNifty Spot Volume Profile:
Bank Nifty had a huge month with the index jumping from the lows of 8606 to the highs of 11220 (range of 2614 points) within a span of just 3 weeks, but saw huge unwinding in the latter half to close at 9617.80, still a gain of 568.60 points or approx 6.3%.
The ATR(12) for the month was highest one for the year at 1409.61 points and the index saw many 500 points moves per day.

The Monthly Spot Profile Values are: VAH-10971, POC-10243, VAL-9516 and Monthly VWAP at 10010.
BankNifty as per profile has closed just a few points above VAL, which is weak, and can see VAL within a few days. A close below VAL can bring around 9167 and the lows of the month around 8620. Only a move above VWAP and better still above POC of 10243, can see the index making dash towards VAH at 10971.
Sunday, September 8, 2013

Saturday, August 31, 2013
Nifty & BankNifty Monthly Volume Profile Analysis
Nifty Spot Volume Profile:
A tailor made month for the Bears, with Nifty starting the month with a high of 5808.50 and making a low of 5118.85 towards the end, a range of 689.65 against the monthly ATR(12) of 422.73. The month had many 100 pointer day with the highest range of 235.65. Nifty closed the month just above the psychological level of 5400 at 5471.80, a huge loss of 4.7% month-on-month. It was the lowest monthly close of the year.

The Monthly Spot Profile Values are: VAH-5621, POC-5417, VAL-5214 and Monthly VWAP at 5510
Nifty as per profile has closed just above POC, and holding the same can see VAH at 5621, but has to overcome the VWAP level at 5510. Above VWAP, Nifty will be back above Bull level only on sustained close above VWAP. A close below POC can bring VAL and the lows around 5120.
Crucial Level for the Month is stationed at 5510
BankNifty Spot Volume Profile:
The downtrend in BankNifty continues unabated with the index losing more than 9.7% after making a high of 10219.60 and a low of 8366.75 to close at 9049.20. The range for the month was 1852.85, against a monthly ATR(12) of 1300. The index has lost around 5000 points in the last 73 session and in the last 2 months has lost 22.1%.

The Monthly Spot Profile Values are: VAH-10194, POC-9729, VAL-9191 and Monthly VWAP at 9501.
BankNifty as per profile has closed below VAL, which is weak, but closing above VAL may kick in the 80% rule, towards 9729 and 10194, but staying below VAL may bring back the lows of the month and may be more new lows for the year. Only a close above VWAP will have a positive impact on the index.
Thursday, August 22, 2013
NIFTY bottomed out today....
Below a simple chart that shows NIFTY may have bottomed out today...


Reasons: -
1. Developing diamond pattern at low
2. Positive divergence
3. Bullish butterfly
4. Bullish cross in Stochastic
5. Oversold CCI
As of now target becomes 5480/5550 there is resistance placed around 5560...
Sunday, July 28, 2013
Analysis of BANK NIFTY
Previous week we saw decent fall in Bank
Nifty and it has closed below all MAs. BN is looking very bearish. But is it
all? Let’s see..
The broader picture...
After giving selling cross in stochastic,
till date BN has broken all trendline support and trading below it. We have
another three trading days to go, BN has to save 11150 level to get some
breather. But till it is trading below 12050, it is short on rise. Only a close
above 12050 may change the scenario for the time being.

The medium term...
Although weekly chart of BN is looking very
bearish but hope starts to build in no-confidence zone. As the weekly chart
suggests 10350 is decent support and weekly closing above 10810 is hood for
some 500-600 (or more) points upmove. As of now weekly chart is oversold (although
it can be in oversold zone for long only price may confirm upmove) and may look
for some respite before fall again.

The immediate term...
On 30 min chart, we can see positive
divergence till closing and it may have some effects with some upmove. As per
30 min chart, 11200 level is decent resistance.

Levels
5EMA: 10747 21DEMA: 11198 5DSMA: 10825 5WEMA: 11243
Wish you happy trading...
Sunday, June 30, 2013
Nifty Volume Profile Analysis for July
A roller coaster ride for the index in the month of June with highs of 6011.00 and lows pegged at 5566.25 closing just above the average price at 5842.20

The Monthly Spot Values are: VAH-6009, POC-5920, VAL-5681
Monthly VWAP is at 5782
Nifty as per profile has closed above VWAP and VAL but just below POC, and staying above VWAP a move towards the first resistance zone around 5920 and then towards VAH at 6009 are possible. A close below VWAP will bring back weakness in Nifty and the index can seek lower level at VAL of 5681.
A pullback towards VWAP could be good place to enter longs.
Wednesday, June 12, 2013
Is there any chance of reversal in NIFTY?
NIFTY made low of 5740 and bounced back to 5795 level but the gain was eroded with last hour selling, hence it formed candle with very small real body.

Now, If we look closely to chart we can see that NIFTY formed reversal pattern in EOD candle which need follow up candle tomorrow . But a candle is not sufficient to chalkout reversal as NIFTY has closed below all major EMAs/SMAs and channel support. But aggressive contra trader may take risk of 20 points SL to buy around 5750-5760. Safe buy would be only closing above 5835. Trend followers are suggested to short at high near resistance or fibonacci retracement levels.
Some important observations:
- NIFTY closed below all EMAs/SMAs, channel support and 61.8% retracement level of entire rise from 5477 to 6229.
- Reversal candle stick pattern seen in EOD.
- NIFTY took support at long term support level at 5740.
- RSI is turning up.
- Oversold stochastic (although it may remain oversold for long time period)
Plan your trade and trade the plan.
Sunday, June 2, 2013
Analysis of NIFTY - 31st May 2013
This week NIFTY's range seems to be narrow within the violet and green line unless it crosses any one line closing basis. Before going into conclusion on trading strategy, here are some observations which may help us immensely to track out the NIFTY's course of movement.

1. NIFTY closed below violet line and low of 27th May's candle and 31st May's candle is same.
2. Gap exists between 5844 and 5853 (marked by blue circle) and 50% retracement of entire rise from 5477 to 6229 falls nearly at 5855. 5855 is good enough support zone as indicated by black line.
3. RSI is standing at nearly 50% mark with negative bias as it failed to cross the blue line.
4. Although CCI has cooled off a bit but it is still above 100 marks and stochastic has given selling cross from halfway mark.
5. If we look carefully, a big bullish flag/falling wedge between yellow and green line is seen.
Conclusion and Trade Plan:
As of now NIFTY appears to be sell on rise. Friday's fall may take support around 5905-5915 (green line) and we may see counter rise from there towards violet line (6045-6055). Any level around violet line should be shorted with proper SL. NIFTY may fill the gap of 5844-5853 within the limit of green line. But WEEKLY CLOSE below green line may drag NIFTY down for deeper levels. But failing to close below green line, weekly closing basis, NIFTY may rise towards higher level and bigger bullish flag/falling wedge (between green and yellow line) may come into place.
Wish you happy trading.
Saturday, June 1, 2013
Nifty Spot Volume Profile Analysis
What a month it was, one of the most volatile in recent times, though the range was just 318.50 from 5910.95 - 6229.45, but had many 100 pointer days. The Index ultimately closed at 5985.95 nearer to the lower range.

The Monthly Spot Values are: VAH-6167, POC-6079, VAL-5991 and Monthly VWAP at 6065
Nifty has closed below MVAL, which is very weak and remaining below it can seek the next support level around 5853, with a minor support at 5929. Below 5853, the Bullish trend will go for a toss and we can see 5750, 5685.
Two daily close above 5991 can bring in POC at 6079 and VAH at 6167.
Based on the above, it’s a Sell on rise till MPOC is not captured on closing basis.
Sunday, April 21, 2013
Nifty Weekly View for Expiry
Standing at crossroad, with both Stochastic and RSI in buy, whereas MacD still to make a move and the overhead Trendline Resistance coming around 5835.
Fresh breakout only above 5835, else can stay in a range of 5700-5835 till expiry.
Looking at OI position, a short covering rally can move the index beyond 5835, but if the 5800CE writers stay put then probable expiry will be within the range.
The retracement for the fall from 6111.8 to 5477.2, the 50% comes at 5795 and 61.8% at 5869.
100 SMA is around 5859

Wednesday, March 27, 2013
IS IT GOOD TIME TO BUY?
IS IT GOOD TIME TO BUY?
A CONTRARIAN APPROACH TO STUDY OF NIFTY
22nd January we analysed that NIFTY has all probability to reach 55XX. Although it did not touch that level, yet it is closer to it.
NIFTY
is down by almost 470 points from recent top of 6112; and all important
technical data are indicating bearish sentiment. So, if we follow the trend, it
is evident that we should remain short. But a question comes to mind, is it
good time to buy? Let me try to find the answer with support of some technical
analysis based study, obviously a contrarian approach.
30 MINUTE CHART

A
careful study of 30 min chart comes out with following observations:
1.
Descending
wedge and NIFTY is trading above the wedge.
2.
After making
a low on 14th March, NIFTY paused for a day but to fall again; on 26th
March, NIFTY paused again. There are few differences between two pauses:-
a.
Earlier
price could not break out of the falling wedge unlike this time.
b.
Earlier stochastic
broke down immediately while price touched 21 EMA; but this time stochastic is
holding up with possibility of breakout.
Only
similarity is seen on Fast Fall setup. We need to wait for a (High Probable)
crossover of 21 EMA by 5 EMA before taking buying decision.
DAILY CHART

A
careful study of DAILY chart comes out with following observations:
1.
RSI:
If we observe carefully at the RSI pattern it is seen that after making low
(6.9%) on 14th May 2012, there were three major correction and in
each correction RSI made low around 15 % mark and from there NIFTY went for
faster pullback rally. Now, on 8th February RSI made low at 4.3 %
which is lower than previous low of 6.9 % but with much higher price level. It
is one sort of positive divergence. Now RSI stands again at 15 % mark which may
act as reversal level.
2.
RSI
& CCI Combination: Positive divergence is
seen (marked by green line) at RSI with falling CCI. This combination has fair
reliability on REVERSAL.
3.
STOCHASTIC:
Stochastic is at low and positive cross is seen there.
4.
VOLUME:
Rise from 5663 to 5971 was on lower volume which indicated correction from
there. But fall in price from 5971 to 5724 (19/03/2013) was on increasing
volume but after that volume is continuously decreasing. REVERSAL is nearby.
5.
CHART
PATTERN: Inverted hammer on daily
candle stick and similarity of pattern formation (marked with green line) is
indicating REVERSAL is nearby.
WORD OF CAUTION: Price is
trading below most of the Moving Averages and Larger HNS pattern may not be
ruled out which may target 52XX after some retracement (upto 6070) from here.
This view is presented for short to medium term trades (4 to 8 weeks).
TRADES: Please trade
with small SL as per your convenience (5580) and part book at regular interval.
Sunday, March 17, 2013
Nifty Analysis Ahead of Important RBI Policy Declaration on 19/03/2013
WEEKLY CHART:


Some of the observations based on weekly chart:
- Upmove from 5548 to 6112 retraced upto 5663 which is 76.6 % retracement and channel breakout from there.
- Positive crossover in Stochastic and CCI is clearly Visible.
- RSI is moving up from oversold condition with positive divergence (shown in pink colour).
All the above mentioned observations indicate possibility of upmove in near term.
BUT
- CCI is still in overbought zone and
- Past two weeks volume are decreasing.
The above observations are pointing towards some negativity.
Conclusion:
Nifty took support at 34 WSMA and closed above 5 WSMA and 20 WSMA. A positive crossover can also be seen there between 5 & 20 WSMA. So we may buy the dips with proper SL but we need to be cautious at higher levels
DAILY CHART:

Some of the observations based on daily chart:
- Recent price development shows inverse H&S pattern with neckline around 5970. So, above 5970, NIFTY may breakout.
- Possible positive crossover in CCI
- Upmove of stochastic is expected with RSI taking support around green line
- Possible fast rise setup in moving averages.
All the above mentioned observations indicate possibility of upmove in near term.
BUT
- Price is still below 5 SMA
Conclusion:
Nifty took support at 20 DSMA and if price closes above 5970 we may buy it safely with proper SL.
Wednesday, March 13, 2013
Nifty Analysis for 13-03-2013
NIFTY took support at blue line as expected. Now the possibilities for next course of movements given below:-

1. One may take long around 5820-5830 level with SL of 5795 for target of 5860/5880/5895 levels. Once nifty starts trading above 5895 it may move upto 5915. This trade possibility is limited to intraday only unless nifty closes above 5890.
2. Sell the rise should be the strategy of positional traders as NIFTY has given selling signals. Depending upon above mentioned intraday trade setup one may try to sell NIFTY near high (i.e 5880-5895) with SL around 5920 intraday basis and 5895 closing basis.
In my opinion we may see sub 5600 levels before seeing 5950 level. Rest market is supreme and I have every right to be wrong.
Monday, February 25, 2013
Opening Bell for 25/02/2013
Good Morning !! NIFTY may open flat to positive. 5865 and 5835 are the levels for upward and downward movement respectively. On the upside, NIFTY may move upto 5875/5910 and on the downside NIFTY may move upto 5810/5790.
Wish you happy trading!!
Wish you happy trading!!
Tuesday, February 19, 2013
Nifty - Market Profile View
Market Profile: How it helps in taking position...
The first Profile is time based, that is Fixed 30 min candle, and we can how the up-move started around 2 PM

The next Profile, which I use for my Trading is Fixed Volume based, just see that the first 10 bars have consumed time till around 2 PM, and the up-move started after that, which in just 90 mins of trade has produced 22 volume candles.

Inference : The up-move which we saw today was on huge volume...
Sunday, February 17, 2013
LT : A long Term Bet
LT after giving a good run from the lows of 1100 in June 2012 to the highs of 1712, is correcting the whole up-move. As per FIBO retrace its near its 50% correction mark and 61.8% mark comes around 1340.

Yearly Values : VAH-1545, POC-1349, VAL-1153
Now coming to the Long term Profile Picture, the yearly POC of LT is around 1349, near to the 61.8% Fibo mark.
Short to Long Term Traders can go for a Long around current level and on DIPS around 1380-1400 level for a minimum target of 1545, and above that can see the highs of 1710, 1870, keeping a SL of 1340 on Closing basis.
Thursday, February 14, 2013
Opening Bell for 14/02/2013
Good Morning !! As per yesterday's Opening Bell, NIFTY opened above 5940 and made high @ 5969 but yet another time it could not sustain at higher levels. For today 5920 becomes crucial level. Staying above 5945 is requirement for bulls to stay afloat.
Hourly closing below 5920 will invite bears for a decent fall.
Wish you happy trading !!
Hourly closing below 5920 will invite bears for a decent fall.
Wish you happy trading !!
Wednesday, February 13, 2013
Opening Bell for 13/02/2013
Good Morning !! As per yesterday's opening bell, NIFTY closed above 5920 which is an indication of certain pull back. Today, for bull to stay afloat, NIFTY needs to scale higher levels of 5940/5975 (spot). 5910 may act as support.
On the other hand, breaking of 5910 and staying below that level may invite more fall to 5880/5865 level.
Wish you happy trading !!
On the other hand, breaking of 5910 and staying below that level may invite more fall to 5880/5865 level.
Wish you happy trading !!
Tuesday, February 12, 2013
Opening Bell for 12/02/2013
Good Morning !! For the first time in the year NIFTY closed below 5900. Immediate resistance placed at 5910 . Above that 5920/5940/5975 are the levels to watch out. On lower side immediate support placed at 5880. Below that level, NIFTY may move down to 5865/5840/5790.
Wish you happy trading !!
Wish you happy trading !!
Monday, February 11, 2013
Opening Bell for 11/02/2013
Good Morning !! NIFTY may open flat to positive. 5921/5945 are the levels to watch on the upper level and 5880/5865 are the levels to watch on the lower level. A range bound trading session is expected. Sell near resistance and buy near support should be the trade for the day. Breakout possibility arise only above 5945.
Wish you happy trading !!
Wish you happy trading !!
Wednesday, February 6, 2013
Opening Bell for 6/2/2013
Good Morning !! NIFTY may open flat to positive. As we said yesterday in our Opening Bell, 5956-5970 becomes important level, NIFTY could not break 5956 closing basis. Above 5980, NIFTY may go for higher levels of 6005/6020/6035 and below 5945, NIFTY may come down to 5930/5910/5895.
Wish you happy trading !!
Wish you happy trading !!
Tuesday, February 5, 2013
Opening Bell for 5/2/2013
Good Morning !!NIFTY may open negative to gap-down. Two scenario may appear:
1. After opening negative to gap-down it may immediately fill the opening gap and trade in volatile narrow range
2. After opening negative to gap-down, it may trade for time correction rather price correction and price may come down further after time correction.
5956-5970 becomes important level in the downside where as 6020-6045 becomes important level in the upside.
Wish you happy trading !!
Monday, February 4, 2013
Market Profile 3-I day
3I in normal term is extension of IB range either on the up or down three times the IB range value. 3I day is based on initiating activity of either the seller or buyer to push the price in their favor.
Here is the Market Profile chart of Nifty for the 04th February 2013 for our reference.

IB range: 6063-6039, 24 points
3I day extension on Lower side: 6063 – 24 x 3 = 5991, the low made was 5990.30
The sellers initiating activity saw Nifty going below the IB range and closing around the lows of the day. Normally after a 3I day, the next day IB becomes very important, with the IB low becomes the Stop Loss for longs taken above IB high or VAL
Opening Bell for 4/2/2013
Good Morning !! NIFTY may open flat to positive. Positive divergence developing in 30 min T/F. Breaking the channel above (6020) NIFTY may target 6035/6055/6070. CCI is oversold; so, we may expect a intraday bounce back. Day closing above 6080 may pave way for new high.
Wish you happy trading !!

Wish you happy trading !!
Friday, February 1, 2013
Nifty Spot Monthly Profile Analysis
Market Profile Values of Nifty Spot (Monthly T/F)
MVAH : 6050
MPOC : 6003
MVAL : 5956

Based on the above values, Bull Trend will be over on a close below 5956 for at least 2-3 days, till then its Buy the Dips
MVAH : 6050
MPOC : 6003
MVAL : 5956

Based on the above values, Bull Trend will be over on a close below 5956 for at least 2-3 days, till then its Buy the Dips
Thursday, January 31, 2013
Opening Bell for 31/01/2013
Good Morning !! January series is one of the longest series which is coming to an end today. We expect a lot of volatility today as it is month end too. Today's strategy should be sell the rise. 6085 is difficult zone as of now. One should try selling NIFTY between 6075-6085 with SL of 6105 for target of 6050/6030/6010/5990
Yesterday, our two result special calls on ARVIND and TITAN were hugely profitable.
Wish you happy trading !!
Wednesday, January 30, 2013
RESULT SPECIAL CALLS
WE HAVE DONE IT AGAIN AND DOING IT EVERY DAY...AGAIN AND AGAIN...
30/01/2013: BUY ARVIND 95 JAN CE @ 0.40 SL 0 TARGET 1/2/3 HIITS FIRST TARGET....AND PART BOOKED @ 1.40
Opening Bell for 30/01/2013
Good Morning !! Yesterday due to profit booking NIFTY could not sustain at higher level and closed below 6050. Today we may see some pull back towards 6080-6085 level from where we may see profit booking again. Fresh buying can be seen only above 6100.
As NIFTY is approaching close to expiry of this series, it may remain volatile. Traders are suggested to trade according to levels only and we are expecting a range between 6000 to 6100.
Wish you happy trading.
We are providing accurate Result Special Calls. To enjoy our services please visit our services page for detailed subscription plan.
Tuesday, January 29, 2013
RESULT SPECIAL CALL
WE HAVE DONE IT AGAIN AND DOING IT EVERY DAY...AGAIN AND AGAIN...
29/01/2013: BUY CENTURY TEXTILE AT 402 SL 397 TARGET 410/XXX HITS FIRST TARGET....
Opening Bell for 29/01/2013
Good Morning !! Our Result Special calls are perfectly achieving all targets. To take advantage of it please do join us.
Nifty may open flat to negative. Due to important policy declaration of RBI, NIFTY may remain volatile. 6095 should be watch out. Breaking that level, NIFTY may make new high and DAY CLOSING above 6105 may create trading range. On the other hand, trading below 6045 NIFTY may come down substantially and DAY CLOSING below 5990 may give reversal of current trend.
Formation of last two day's candle stick pattern may evolve as EVENING STAR pattern, which is bearish. Invalidation level is 6101.
Wish you happy trading !!!
Monday, January 28, 2013
Opening Bell for 28/01/2013
Good Morning !! NIFTY may open flat to positive. 6090-6095 is important zone of resistance. Above that level, It may go up to 6120/6145 whereas failure to sustain above that level it may go down to 6050/6035.
Buy NIFTY above 6095 SL 6075 target 6120/6145
Sell NIFTY below 6070 SL 6090 target 6050/6035
Wish you Happy trading !!
Buy NIFTY above 6095 SL 6075 target 6120/6145
Sell NIFTY below 6070 SL 6090 target 6050/6035
Wish you Happy trading !!
Saturday, January 26, 2013
VOLTAS - A good stock to buy
Simple charts of VOLTAS shows, it is good time to buy the stocks. Reasons :-
1. Oversold indicators both daily and weekly
2. Hammer on daily and weekly chart which is good enough reversal indicator
3. Took support at 61.8 % retracement level at weekly chart

Daily Chart

Weekly Chart
Friday, January 25, 2013
RESULT SPECIAL CALLS...
WE ARE THE ONLY ANALYST GROUP WHO PROVIDE RESEARCH BASED RESULT SPECIAL CALLS WITH THE HIGHEST PRECISION.
Opening Bell for 24/01/2013
Good Morning !! NIFTY may open flat to positive.

If we look closely at daily chart, it is clear that yesterday NIFTY took support at lower line of rising wedge. There may be possibility of pullback from that level. 6040 is the level to watch. Below that level, NIFTY may come down and above that level NIFTY may go up.
Possible trade setup:
Buy NIFTY above 6040 SL 6020 target 6065/6080
Sell NIFTY below (around) 6040 SL 6060 target 6020/6005/5990
NP-SAR for the day: 6045
Wish you happy trading !!!
Thursday, January 24, 2013
Opening Bell for 24/01/2013
Good Morning !! NIFTY may open flat to negative. It may remain volatile with narrow range of 30-40 points throughout the day. Below 6020, NIFTY may come down to 5990/5975; on the other hand, above 6060 it may move up to 6080/6095.
NP-SAR for 24/01/2013: 6050
Wish you happy trading !!
Tuesday, January 22, 2013
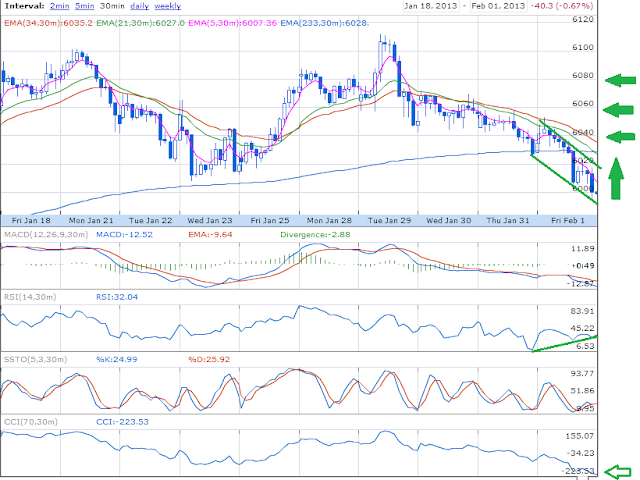
Are we heading towards 55XX ?
Today NIFTY moved exactly as per our opening bell. It sold out below 6080 to hit second target at 6045 then long from 6040 also did 20 points.
Now what next in NIFTY?
To analyse this we need to take some simple things in our consideration.

A] A closer look at the daily chart indicates -
i) NIFTY has lost its pace of movement in upper side and it is selling out at high although we are able to see new highs every alternate day.
ii) NIFTY has broken out of developing rising wedge only to fall at upper boundary of it.
iii) NIFTY is at the climax of the rising wedge with developing negative divergence.

B] A closer look at the weekly chart indicates -
i) NIFTY is rising with RSI falling. A negative weekly close will confirm negative divergence in weekly chart also.
ii) CCI, MACD, STOCHASTIC all are at overbought territory for quite some time.
iii) It appears from weekly chart that NIFTY is forming BEARISH BAT chart pattern.

C] A closer look at 30 min chart indicates that NIFTY is oversold and it may correct today's fall.
In a nutshell, NIFTY is near to its current high (if not made today itself) and a decent fall is awaiting until 6150 is taken out COMFORTABLY (weekly closing).
Happy Trading
Opening Bell for 22/01/2013
Good Morning !! NIFTY may open flat to negative. Trading below 6090 may invite some profit booking in NIFTY and we may see 6065/6045 in lower side. As per OI, 6000 level is decent support so, one may buy the dip for positional gains.
Sell NIFTY below 6080 SL 6095 target 6065/6045
Buy NIFTY around 6040 SL 6025 target 6070/6090/6120
On the other hand, if NIFTY sustains above 6095 then we may see 6120/6140 levels in it.
Sell NIFTY below 6080 SL 6095 target 6065/6045
Buy NIFTY around 6040 SL 6025 target 6070/6090/6120
On the other hand, if NIFTY sustains above 6095 then we may see 6120/6140 levels in it.
NP-SAR OF 22/01/2013: 6041
Wish you happy trading !!
Monday, January 21, 2013
Opening bell for 21/01/2013
Good Morning !!! Due to some unavoidable circumstances we could not post Opening Bell as well as Weekly Wrap. Inconvenience caused to our readers is deeply regretted.
Today NIFTY may open flat to positive. We may see the level of 6090/6120 at the higher side. At higher level we may see some correction of few points. 6140/6150 is weekly channel resistance.
Buy ITC above 290 SL 284 target 300/306 (all cash levels)
Wish you happy trading !!
Today NIFTY may open flat to positive. We may see the level of 6090/6120 at the higher side. At higher level we may see some correction of few points. 6140/6150 is weekly channel resistance.
NP-SAR of 21/01/2013: 6025
Buy ITC above 290 SL 284 target 300/306 (all cash levels)
Wish you happy trading !!
Tuesday, January 15, 2013
Opening Bell for 15/01/2013
Good Morning. NIFTY may open flat to negative. It may consolidate for the day and retrace upto 5995/5985. Depending on prevailing condition, that would be good chance to buy with small SL.. 6038 is the level to watch on the upper side. Above that level we may see 6070/6120 levels in NIFTY. Below 5980 we may see 5930/5905 levels.
NP-SAR of 15/01/2013: 5978
Wish you happy trading !!!
Saturday, January 12, 2013
Nifty Spot Weekly Analysis: A Market Profile Perspective
Weekly Value Areas : VAH-6000, POC-5975, VAL-5950
The Bears had a good week, with Monday starting with the Highs at 6042 and closing on Friday at the low at 5943.55 (Adjusted closing just above at 5951.30), making a gain of around 100 points. Coming back to the chart pattern, Nifty was sold thrice from around the WVAH of 6017 and not a single close was above that for the entire week. As said in my previous weekly analysis below 5973, it went on to fill the low volume area around 5980-5960-5940.

What's in Store for the coming week?
Based on values and the chart pattern, we see huge resistance developing around 5990-6010, and only above that Nifty will be back in Bull territory. Staying below 5950, the low volume area from 5950-5910 should get filled. Staying above 5950, the 80% rule may kick in to move the index back to 6000 level.
Hope this Helps :)
Subscribe to:
Posts (Atom)