Pages

Monday, February 25, 2013

Opening Bell for 25/02/2013

Good Morning !! NIFTY may open flat to positive. 5865 and 5835 are the levels for upward and downward movement respectively. On the upside, NIFTY may move upto 5875/5910 and on the downside NIFTY may move upto 5810/5790.

Wish you happy trading!!

Tuesday, February 19, 2013

Nifty - Market Profile View

Market Profile: How it helps in taking position...

The first Profile is time based, that is Fixed 30 min candle, and we can how the up-move started around 2 PM


The next Profile, which I use for my Trading is Fixed Volume based, just see that the first 10 bars have consumed time till around 2 PM, and the up-move started after that, which in just 90 mins of trade has produced 22 volume candles.

Inference : The up-move which we saw today was on huge volume...

Sunday, February 17, 2013

LT : A long Term Bet

LT after giving a good run from the lows of 1100 in June 2012 to the highs of 1712, is correcting the whole up-move. As per FIBO retrace its near its 50% correction mark and 61.8% mark comes around 1340.


Yearly Values : VAH-1545, POC-1349, VAL-1153

Now coming to the Long term Profile Picture, the yearly POC of LT is around 1349, near to the 61.8% Fibo mark.

Short to Long Term Traders can go for a Long around current level and on DIPS around 1380-1400 level for a minimum target of 1545, and above that can see the highs of 1710, 1870, keeping a SL of 1340 on Closing basis.

Thursday, February 14, 2013

Opening Bell for 14/02/2013

Good Morning !! As per yesterday's Opening Bell, NIFTY opened above 5940 and made high @ 5969 but yet another time it could not sustain at higher levels. For today 5920 becomes crucial level. Staying above 5945 is requirement for bulls to stay afloat.

Hourly closing below 5920 will invite bears for a decent fall.

Wish you happy trading !!

Wednesday, February 13, 2013

Opening Bell for 13/02/2013

Good Morning !! As per yesterday's opening bell, NIFTY closed above 5920 which is an indication of certain pull back. Today, for bull to stay afloat, NIFTY needs to scale higher levels of 5940/5975 (spot). 5910 may act as support.

On the other hand, breaking of 5910 and staying below that level may invite more fall to 5880/5865 level.

Wish you happy trading !!

Tuesday, February 12, 2013

Opening Bell for 12/02/2013

Good Morning !! For the first time in the year NIFTY closed below 5900. Immediate resistance placed at 5910 . Above that 5920/5940/5975 are the levels to watch out. On lower side immediate support placed at 5880. Below that level, NIFTY may move down to 5865/5840/5790. 

Wish you happy trading !!

Monday, February 11, 2013

Opening Bell for 11/02/2013

Good Morning !! NIFTY may open flat to positive. 5921/5945 are the levels to watch on the upper level and 5880/5865 are the levels to watch on the lower level. A range bound trading session is expected. Sell near resistance and buy near support should be the trade for the day. Breakout possibility arise only above 5945.

Wish you happy trading !!

Wednesday, February 6, 2013

Opening Bell for 6/2/2013

Good Morning !! NIFTY may open flat to positive. As we said yesterday in our Opening Bell, 5956-5970 becomes important level, NIFTY could not break 5956 closing basis. Above 5980, NIFTY may go for higher levels of 6005/6020/6035 and below 5945, NIFTY may come down to 5930/5910/5895.

Wish you happy trading !!

Tuesday, February 5, 2013

Opening Bell for 5/2/2013

Good Morning !!NIFTY may open negative to gap-down. Two scenario may appear:
1. After opening negative to gap-down it may immediately fill the opening gap and trade in volatile narrow range
2. After opening negative to gap-down, it may trade for time correction rather price correction and price may come down further after time correction.

5956-5970 becomes important level in the downside where as 6020-6045 becomes important level in the upside.

Wish you happy trading !!

Monday, February 4, 2013

Market Profile 3-I day


3I in normal term is extension of IB range either on the up or down three times the IB range value. 3I day is based on initiating activity of either the seller or buyer to push the price in their favor.

Here is the Market Profile chart of Nifty for the 04th February 2013 for our reference.


IB range: 6063-6039, 24 points

3I day extension on Lower side: 6063 – 24 x 3 = 5991, the low made was 5990.30

The sellers initiating activity saw Nifty going below the IB range and closing around the lows of the day. Normally after a 3I day, the next day IB becomes very important, with the IB low becomes the Stop Loss for longs taken above IB high or VAL

Opening Bell for 4/2/2013

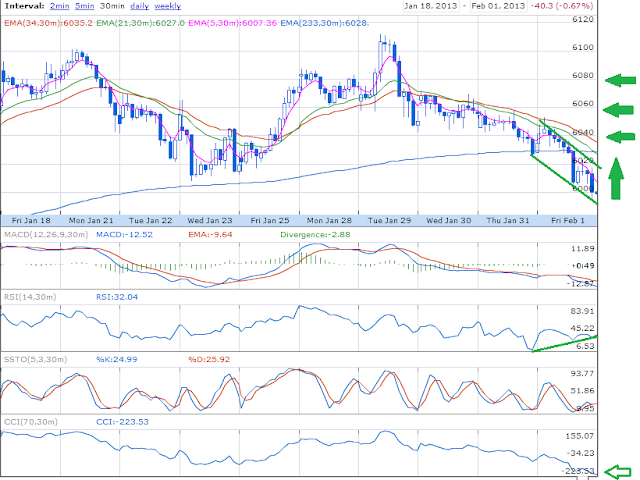
Good Morning !! NIFTY may open flat to positive.  Positive divergence developing in 30 min T/F. Breaking the channel above (6020) NIFTY may target 6035/6055/6070.  CCI is oversold; so, we may expect a intraday bounce back.  Day closing above 6080 may pave way for new high.


Wish you happy trading !!

Friday, February 1, 2013

Nifty Spot Monthly Profile Analysis

Market Profile Values of Nifty Spot (Monthly T/F)

MVAH : 6050
MPOC : 6003
MVAL : 5956


Based on the above values, Bull Trend will be over on a close below 5956 for at least 2-3 days, till then its Buy the Dips